Full integration with AD online – Including Queue Reporting
Analytics and Reporting for Teams, Office365, Skype for Business Online
As industry trends move towards online Unified Communications, Microsoft has a clearly defined strategy and offering with Skype for Business being delivered online through Office 365. With the delivery of UC from the cloud, organisations reporting requirements do not change and visibility of User Adoption, Call Quality, Employee Productivity and Call Costs remains an essential element to the successful deployment and on-going use of Unified Communications. MAF InfoCom™ has ensured that its CDR based monitoring and reporting solution, MAF ICIMS™, is keeping pace with these developments with full support for both Skype for Business online and Active Directory online.
Overview
CDR’s are collected from Skype for Business online using Skype online PowerShell scripts. The frequency of Skype for Business CDR collection is user definable. In a similar way MAF ICIMS™ has full integration with AD online. There is also support for Skype online queues reporting. Used across an organization from the IT department to heads of business MAF ICIMS™ delivers only relevant information through dashboards, monitors and reports.
MAF ICIMS™ Deployment
To accommodate differing customer requirements MAF ICIMS™ can be deployed on-premises or from our cloud which uses Azure.
User Interface
The user interface has a familiar look and feel and allows users to quickly navigate to the key areas of the software using either the shortcut keys or the pop out icons.
Dashboard
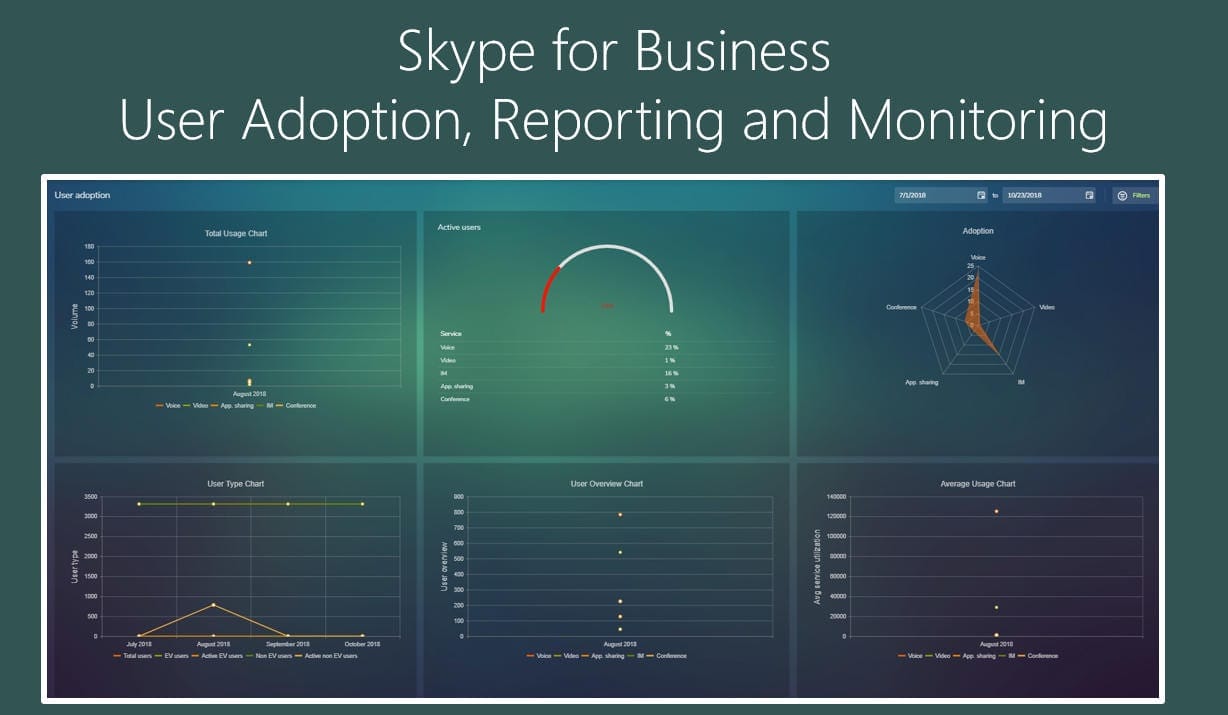
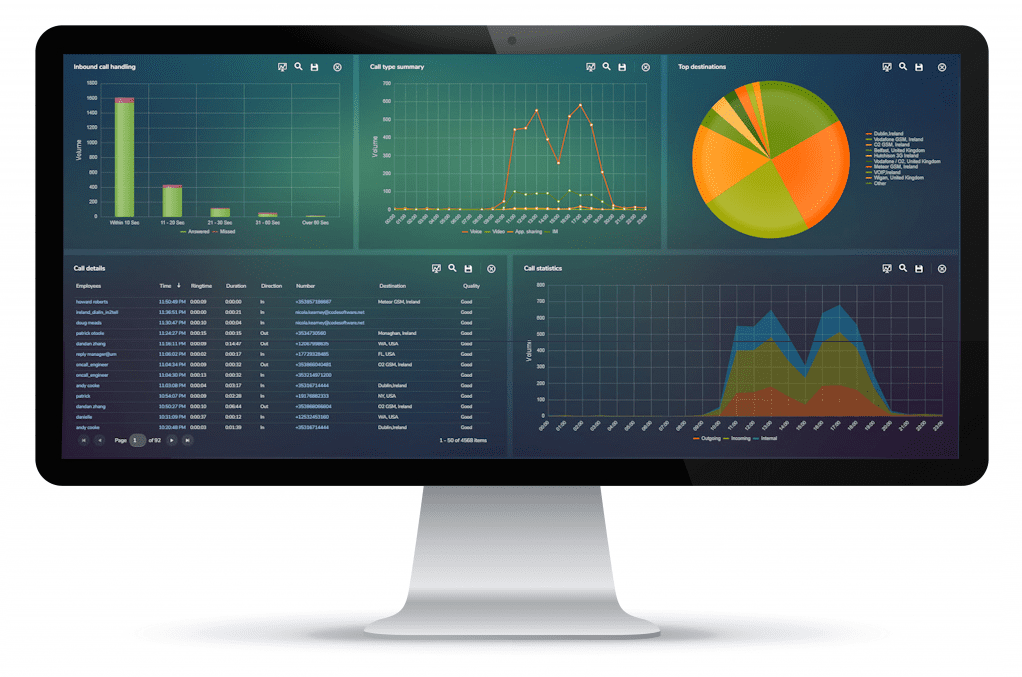
The Office365 and Skype for Business Online dashboard gives a snapshot view of system and employee usage and trends. It is user defined ensuring only relevant information is displayed. You can select the number of charts displayed in the dashboard then the individual chart types for your specific requirements. The layout can then be further configured by dragging and dropping and resizing the charts. Once happy with the layout it can then be saved and simply loaded in the future. Typically, the information displayed will be for the current day but it is possible to select any previous date. The dynamic nature of the dashboards allows filters to be applied directly to them which ensures the relevance of the information displayed. It is also possible to generate a full report from the chart by clicking on the relevant area. Inbound Call Handling, Gateways Summary, Call Statistics, Call Details, Top Destinations, Call Type Summary, Mean Opinion Score (MOS), Inbound Call Summary, Call Distribution by Location, Client Types, Quality Trend, Conference Statistics, Outbound Dials, Peak Traffic, Subnet Quality, Top Diagnostics ID Failures.
Reporting
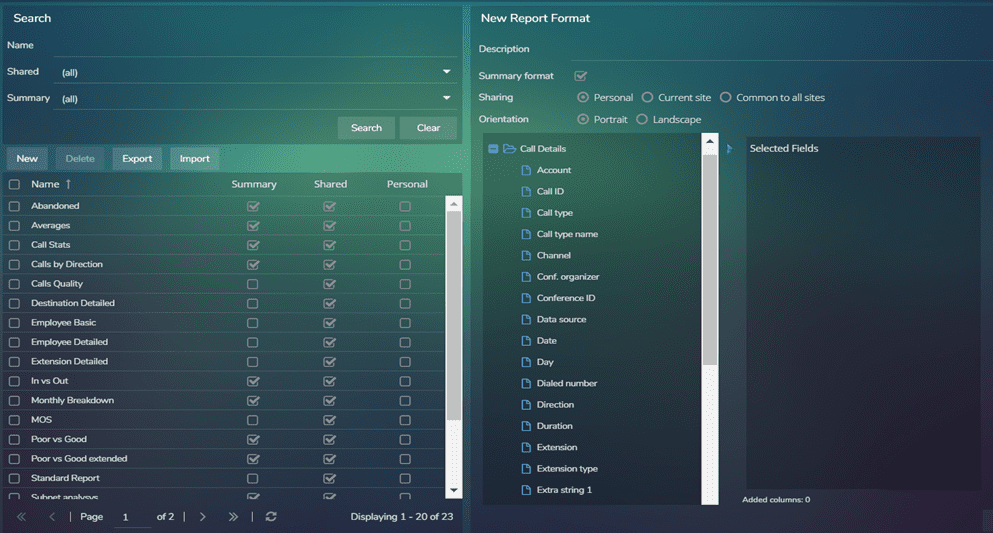
Teams, Office365 and Skype for Business Online Reports can be scheduled to run automatically or generated on an ad-hoc basis, users can use pre-defined templates or create their own layout using the report designer then filter and sort reports using the report builder. The reports can be saved as templates for quick future access. The reporting options are literally unlimited. Reports are generated in MS Word, MS Excel, PDF or CSV format

Report Designer
Creating new reports for Office365 and Skype for Business Online with only relevant fields is achieved with the report designer by simply dragging and dropping the required CDR fields, once selected you can further amend fields by repositioning, changing the text displayed or other field attributes such as width. If a summary report format is selected it is possible to further customize the field by adding filters such as changing the aggregation method or specific conditions including call type, date range, ring time or service type
Report Builder
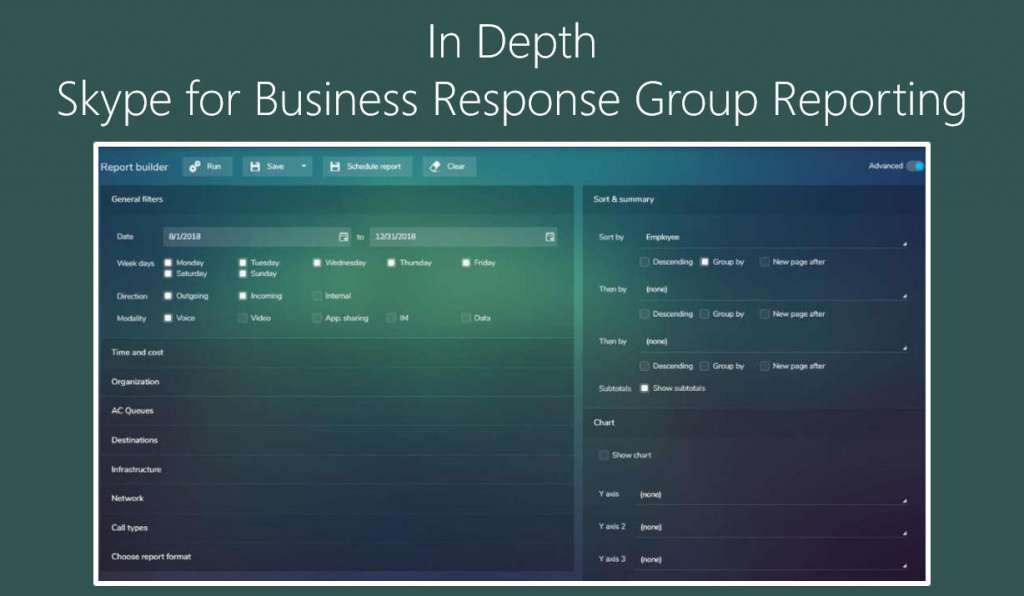
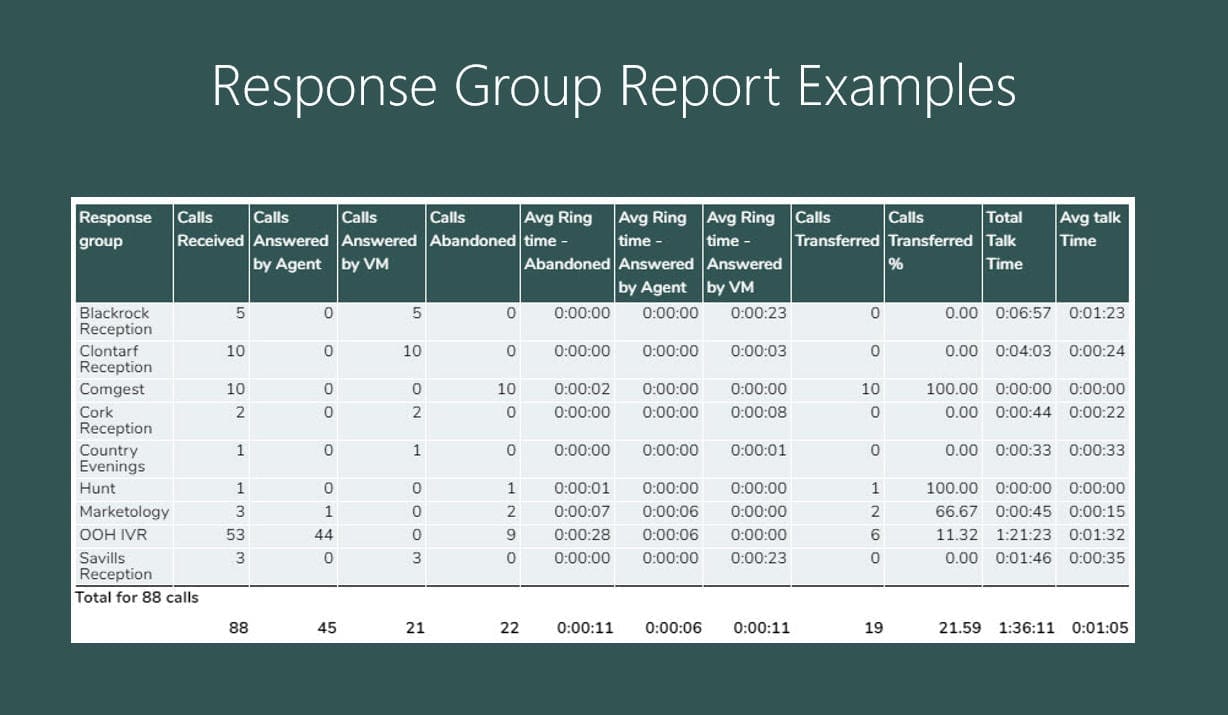
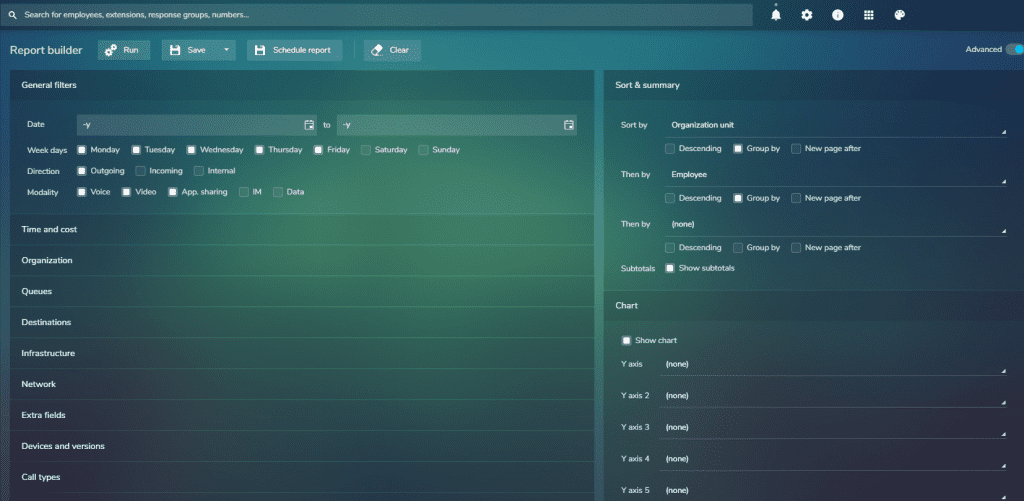
Once the new format is satisfactory it is saved and on opening the Office365 and Skype for Business Online report builder it is selected and when generated the report will only display the required fields. The report builder is where filters and sorting criteria are defined. General filters can be applied on date, time, call duration, ring time and cost. Call direction and service type can also be selected along with specific call types which can be equal or not equal to those checked. Additionally, you can apply filters at organisation level, for specific response groups, call destination, gateways or SBC’s, IP Fields such as subnets and device details. If required, the Teams or Skype for Business report can then have up to 3 levels of sorting to assist in delivering the information in the easiest to view format. Charts can also be included with up to 5 user defined criteria and a selection of chart types is offered bar, stacked bar, line or pie.
System Monitors
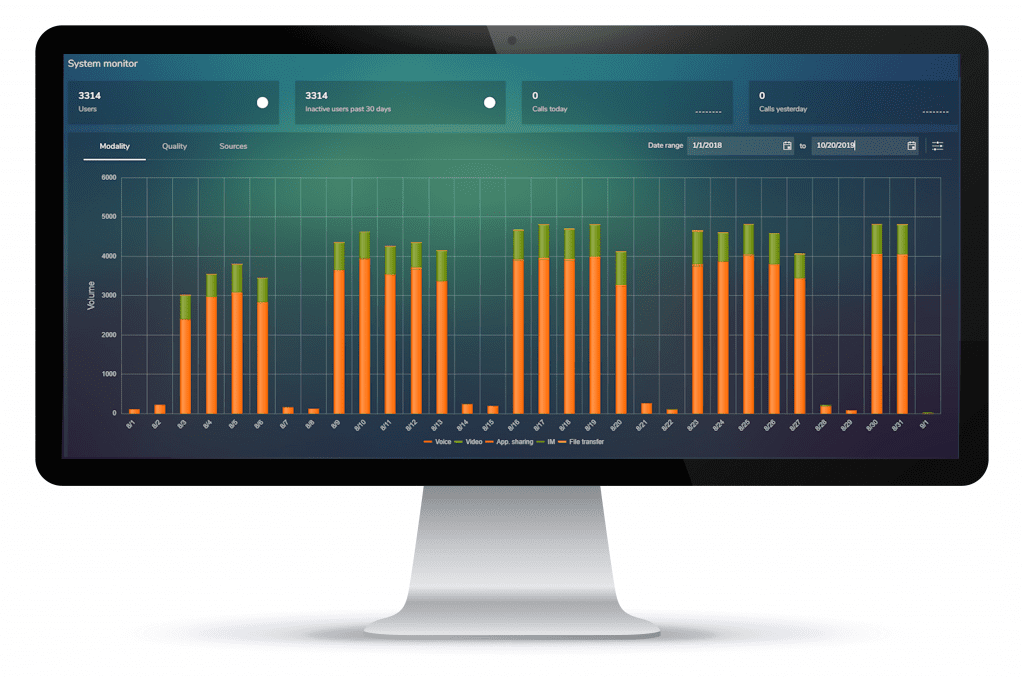
In addition to the dashboard there are Office365 and Skype for Business Online system monitors which give a clear, high level view of system performance and consumption of Skype for Business for a user defined date range. The modality system monitor shows total collaboration figures for each day and mousing over a specific day you can see a breakdown of the different types – Voice, Video, IM and App Sharing.
Call Quality System Monitor
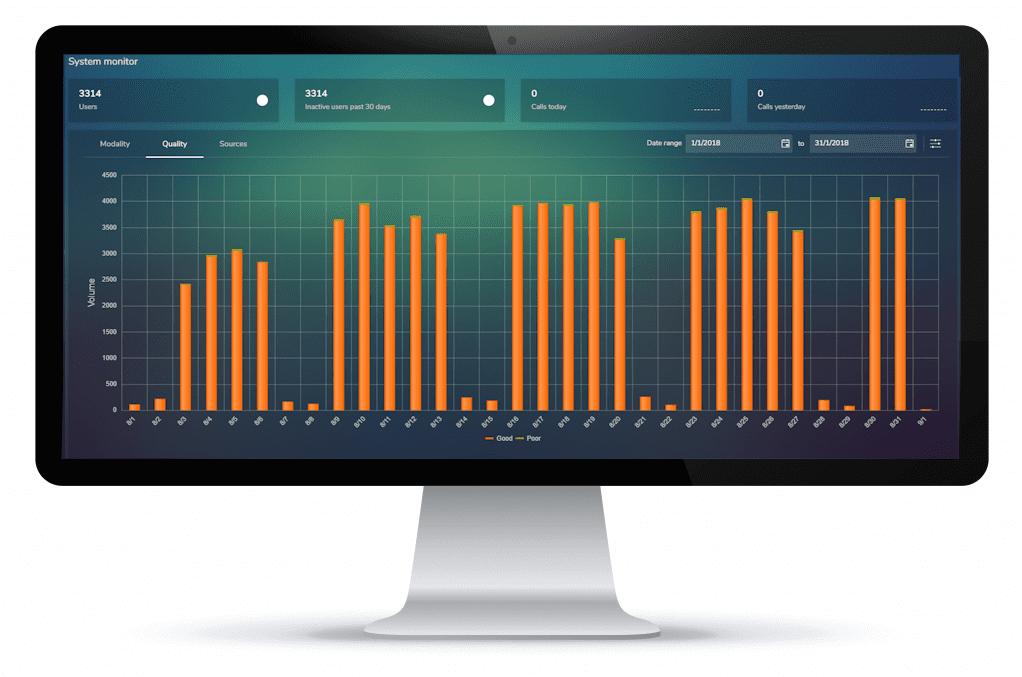
The Teams, Office365 and Skype for Business Online call quality system monitor displays the volumes of calls falling within the Microsoft methodology of identifying a call as having been either a good or a poor quality call. You can also see from the system monitors the number of active and inactive users across the entire system giving a view of consumption along with total collaboration activity for today and yesterday.
Call Detail Monitor
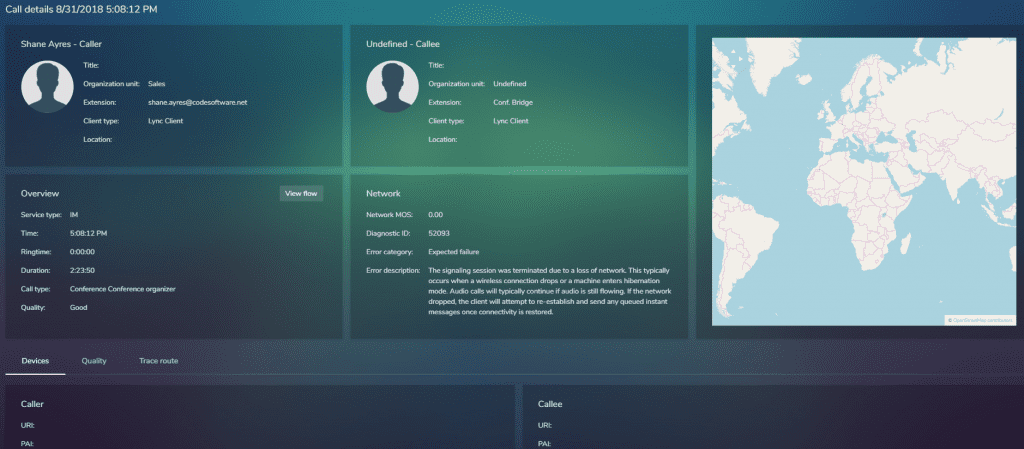
If a more detailed view is required for an individual Office365 or Skype for Business Online call there is the call detail monitor. This is typically used to quickly see detailed call quality information used for route cause analysis of any issues. It is accessed from the call detail dashboard monitor and where basic call details can be seen including the call quality score. Clicking on the icon for the relevant call opens the call detail monitor which has comprehensive call statistics on both caller and callee. You can see general information; date, time, duration, ring time along and a map showing the legs of the call. Specific quality related details can be seen including network MOS, Jitter and packet loss. Device information includes client type and version, connection type was it a wired, wifi or VPN? What devices were used such as headset types giving a view of approved or unapproved devices.
User Map Employee Details
User Adoption and Office365, Skype for Business Online Call Quality are the two key elements to ensuring the successful and productive delivery and on-going usage of Skype for Business. MAF ICIMS™ now delivers this combined information for a selected user in a simple to interpret and navigate interface with the User Map. This shows for a selected user and time frame detailed information on activity and associated call quality.
The Calls section show details for all Voice, Video, IM, Data and App Sharing activity for the selected user in the defined activity date range displaying date and start time, call participants and call quality. The call quality is based on the Microsoft methodology of grading call quality as being simply ‘Good’ or ‘Poor’ quality. If required, the call detail monitor (Previously detailed) can be opened from here by clicking on an individual call.
Conferences Organized and Conferences Attended displays all conferences that the selected employee has organized and those attended with details of date and start time, number of participants and duration.Clicking on a specific Conference will open the Conference Details in a new tab.
Conference Details
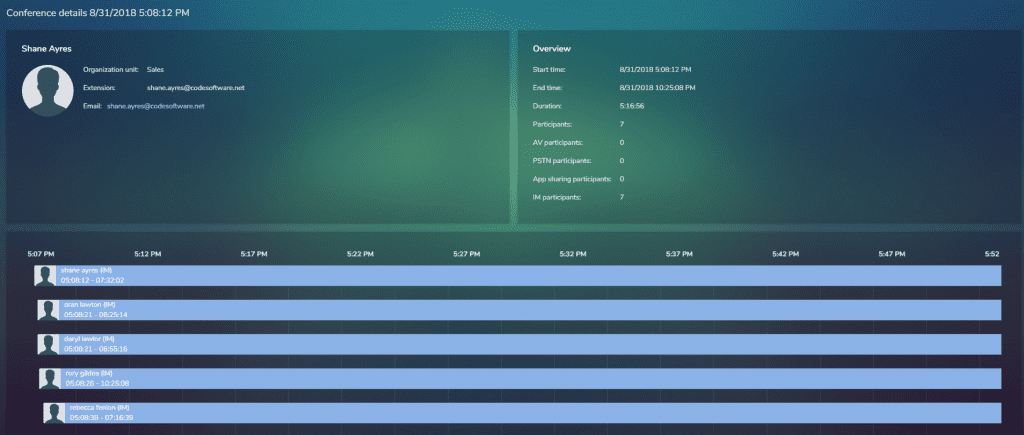
Office365 and Skype for Business Online Conference Details. Here there are 2 views; Modality and Quality. Modality shows specific details for all conference attendees and use of the available collaboration modes available with Skype for Business including the duration which is displayed in the colour coded chart. Mousing over the relevant area on the chart will give specific information for the collaboration mode. The Quality view displays each attendees user experience as being either Good (Green) or Bad (Red). Any element of the Gannt chart can be clicked on to open the Call Detail Monitor. An Overview of the conference is also displayed.
Security Policies
The comprehensive, user defined security options are key to the successful delivery and usage of MAF ICIMS™. It allows system administrators to configure user details and security policies which limits use of features and at an organizational level including full support for multi-tenanted environments.
Alarms
It is possible to set up an unlimited number of system alarms which alert when a call threshold has been met. Typically the alert is delivered via email. Thresholds can be set on call duration, ring-time, call costs, Mean Opinion Score (MOS) and error ID.
Information & Contact
Questions about Teams, Office365 and Skype for Business Online reporting?
Call us at +3172-8200205 or mail at info@mafinfo.com our salesteam is ready for you.
